Anti-aliasing properties of kernel functions
In [1]:
import matplotlib.pyplot as plt
import matplotlib.image as mpimg
import numpy as np
%matplotlib inline
# Plot image pixels in cartesian ordering (i.e. y-positive == upwards):
plt.rcParams['image.origin'] = 'lower'
# Make plots bigger
plt.rcParams['figure.figsize'] = 6, 6
In [2]:
import fastimgproto.gridder.conv_funcs as conv_funcs
from fastimgproto.gridder.kernel_generation import Kernel
narrow_g_sinc = conv_funcs.GaussianSinc(trunc=3.)
oversampling=1
support = 32
gs_kernel = Kernel(kernel_func=narrow_g_sinc, support=support,oversampling=oversampling)
cross_section = gs_kernel.array[gs_kernel.centre_idx]
In [3]:
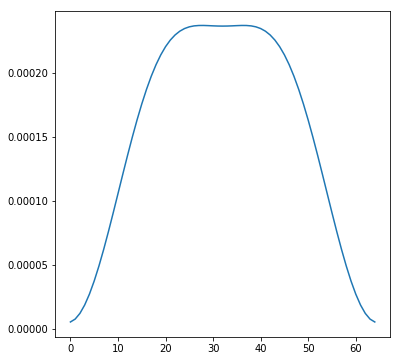
plt.plot(cross_section)
Out[3]:
[<matplotlib.lines.Line2D at 0x7fd03a9f7ed0>]
In [4]:
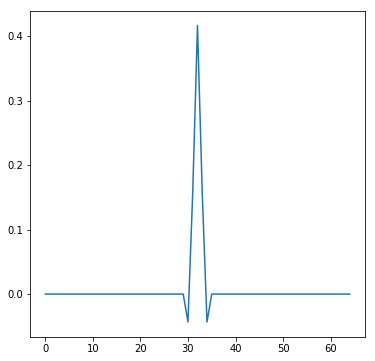
shifted = np.fft.ifftshift(cross_section)
In [5]:
shifted[0]
Out[5]:
0.41675735397798913
In [6]:
shifted[-1], shifted[1]
Out[6]:
(0.15770968729136908, 0.15770968729136908)
In [7]:
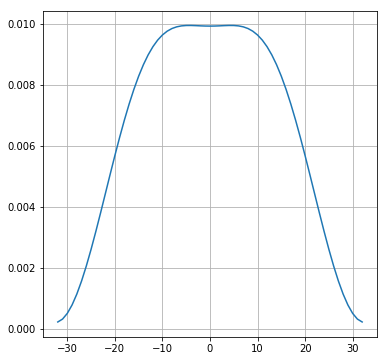
amp = np.abs(np.fft.fftshift(np.fft.ifft(np.fft.ifftshift(cross_section))))
fig = plt.figure()
ax = fig.gca()
# plot_section = np.log10(amp[:oversampling])
ax.plot(np.arange(len(amp))-support, amp)
ax.grid()
In [8]:
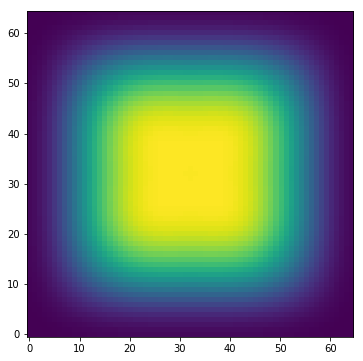
C_grid = np.fft.fftshift(np.fft.ifft2(np.fft.ifftshift(gs_kernel.array)))
In [9]:
plt.imshow(np.abs(C_grid))
Out[9]:
<matplotlib.image.AxesImage at 0x7fd03a654cd0>
In [10]:
plt.plot(np.abs(C_grid)[support])
Out[10]:
[<matplotlib.lines.Line2D at 0x7fd038861ed0>]