Example visibility-simulation and imaging
In [1]:
import numpy as np
import logging
import os

import astropy.units as u
import astropy.constants as const
import scipy.stats

import fastimgproto.imager as imager
import fastimgproto.visibility as visibility

from astropy.coordinates import Angle, SkyCoord, AltAz, EarthLocation
from astropy.time import Time

from fastimgproto.gridder.conv_funcs import GaussianSinc
from fastimgproto.skymodel.helpers import SkyRegion, SkySource
from fastimgproto.sourcefind.image import SourceFindImage
from fastimgproto.telescope.readymade import Meerkat
In [2]:
# from tqdm import tqdm_notebook as Tqdm
from tqdm import tqdm as Tqdm
In [3]:
import matplotlib.pyplot as plt
import matplotlib.image as mpimg
%matplotlib inline
# Plot image pixels in cartesian ordering (i.e. y-positive == upwards):
plt.rcParams['image.origin'] = 'lower'
# Make plots bigger
plt.rcParams['figure.figsize'] = 10, 10
In [4]:
telescope = Meerkat()
print("Telescope with {} antennae == {} baselines".format(
    len(telescope.ant_local_xyz), len(telescope.baseline_local_xyz)))
print("Centre: {!r}, {!r}".format(telescope.lon, telescope.lat))
Telescope with 64 antennae == 2016 baselines
Centre: <Longitude 21.443270030936162 deg>, <Latitude -30.712485463619643 deg>
In [5]:
pointing_centre = SkyCoord(0 * u.deg, -30 * u.deg)
obs_central_frequency = 3. * u.GHz
wavelength = const.c / obs_central_frequency
transit_time = telescope.next_transit(pointing_centre.ra,
                                      start_time=Time('2017-01-01'))
Downloading http://maia.usno.navy.mil/ser7/finals2000A.all
/home/docs/checkouts/readthedocs.org/user_builds/ska-fastimaging-python/envs/latest/lib/python2.7/site-packages/astropy-2.0.1-py2.7-linux-x86_64.egg/astropy/time/core.py:749: UnicodeWarning: Unicode equal comparison failed to convert both arguments to Unicode - interpreting them as being unequal
  elif longitude == 'greenwich':
[Done]
Let’s check that the transit-time calculation is approximately correct. We chose the target SkyCoord to have the same celestial latitude as Meerkat’s geographical latitude, so it should transit near zenith:
In [6]:
altaz = pointing_centre.transform_to(
    AltAz(obstime=transit_time,
         location=telescope.centre))
altaz.alt.deg
Out[6]:
89.17591321744462
In [7]:
nstep=10
obs_times = transit_time + np.linspace(-1, 1, nstep) * u.hr
print("Generating UVW-baselines for {} timesteps".format(nstep))
uvw_m = telescope.uvw_tracking_skycoord(pointing_centre, obs_times)
# From here on we use UVW as multiples of wavelength, lambda:
uvw_lambda = (uvw_m / wavelength).to(u.dimensionless_unscaled).value


# Additional source to North-East of pointing centre
extra_src_position = SkyCoord(ra=pointing_centre.ra + 0.01 * u.deg,
                              dec=pointing_centre.dec + 0.01 * u.deg, )

steady_sources = [
    SkySource(pointing_centre, flux=1 * u.Jy),
    SkySource(extra_src_position, flux=0.4 * u.Jy),
]

# Simulate incoming data; includes transient sources, noise:
print("Simulating visibilities")
data_vis = visibility.visibilities_for_source_list(
    pointing_centre,
    source_list = steady_sources,
    uvw = uvw_lambda)

vis_noise_level = 0.1 * u.Jy
data_vis = visibility.add_gaussian_noise(vis_noise_level, data_vis)
vis_weights =  np.minimum(1.0, scipy.stats.lognorm.rvs(s=0.25, size=len(data_vis)))
Generating UVW-baselines for 10 timesteps
Simulating visibilities
In [8]:
print("Simulated {} visibilities".format(len(data_vis)))
Simulated 20160 visibilities
In [9]:
image_size=1024 * u.pixel
cell_size=1 * u.arcsecond
In [10]:
kernel_support = 3
kernel_func = GaussianSinc(trunc=kernel_support)
with Tqdm() as progress_bar:
    image, beam = imager.image_visibilities(vis=data_vis,
                                            vis_weights=vis_weights,
                                            uvw_lambda=uvw_lambda,
                                            image_size=image_size,
                                            cell_size=cell_size,
                                            kernel_func=kernel_func,
                                            kernel_support=kernel_support,
                                            kernel_exact=True,
                                            kernel_oversampling=None,
                                            progress_bar=progress_bar
                                            )
image = np.real(image)
Gridding visibilities100%|██████████| 20160/20160 [00:04<00:00, 4037.75it/s]
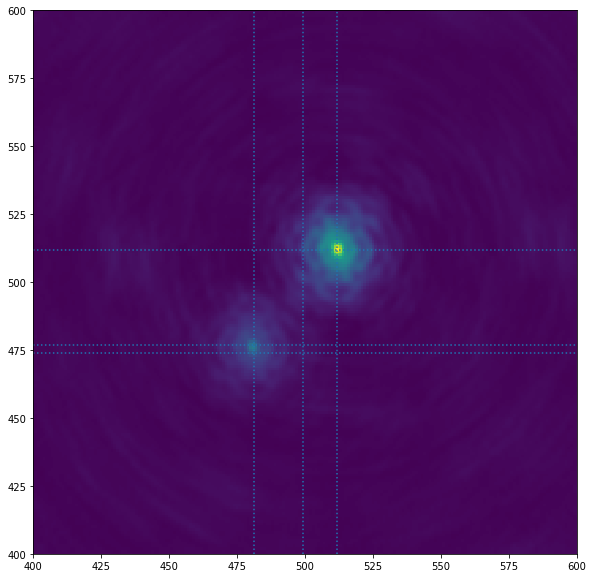
Finally, let’s run our rudimentary sourcefinder on the image, and plot the results:
In [11]:
from fastimgproto.sourcefind.image import SourceFindImage
In [12]:
detection_n_sigma=20
analysis_n_sigma=15
sfimage = SourceFindImage(data=np.real(image),
                          detection_n_sigma=detection_n_sigma,
                          analysis_n_sigma=analysis_n_sigma,
                          )
In [13]:
sfimage.islands
Out[13]:
[IslandParams(parent=<fastimgproto.sourcefind.image.SourceFindImage object at 0x7f20012d0110>, label_idx=1, sign=1, extremum_val=0.4020550655819588, extremum_x_idx=481, extremum_y_idx=476, xbar=481.06840085411756, ybar=476.97774076070596),
 IslandParams(parent=<fastimgproto.sourcefind.image.SourceFindImage object at 0x7f20012d0110>, label_idx=2, sign=1, extremum_val=0.050036024260904644, extremum_x_idx=499, extremum_y_idx=474, xbar=499.25554207516933, ybar=473.71256270487487),
 IslandParams(parent=<fastimgproto.sourcefind.image.SourceFindImage object at 0x7f20012d0110>, label_idx=4, sign=1, extremum_val=0.99980538241727068, extremum_x_idx=512, extremum_y_idx=512, xbar=511.76108285952313, ybar=511.67059456956849)]
In [14]:
src = sfimage.islands[0]
In [15]:
fig, ax1 = plt.subplots(1,1)
ax1.imshow(image)
axlims = 400, 600
ax1.set_xlim(axlims)
ax1.set_ylim(axlims)
for src in sfimage.islands:
    ax1.axvline(src.xbar, ls=':')
    ax1.axhline(src.ybar, ls=':')